Number of Questionnaires sent and participation rates
The table linked below shows the number of messages sent by the universities in the Student Survey documents and the return rates. This data represents the net return, excluding students that were not accessible by post(e.g. due abroad, illness or leave of absence).
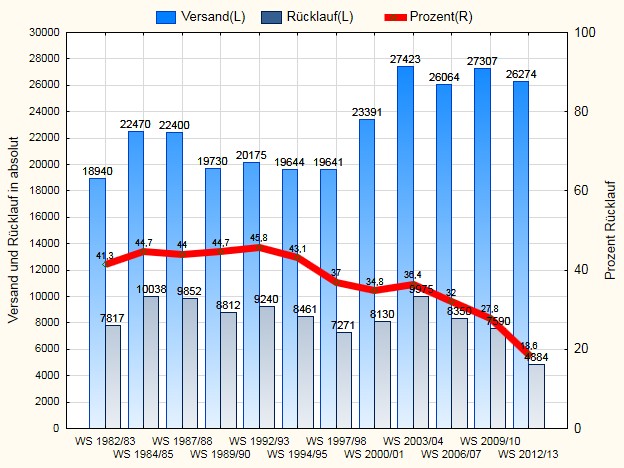
For the first six surveys of Student Surveys, the total return of usable questionnaires was consistently above 40% and reached its peak in the WS 1992/93 at 45.8%. The seventh survey, WS 1997/98, yielded a return rate of 37.0%, the eighth survey, WS 2000/2001, a return rate of 34.8%, and the ninth survey, WS 2003/04, resulted in a return rate of 36.4%. For the survey conducted in WS 2006/07, the return rate was 32.0%. The survey conducted in the WS 2009/2010, resulted in the low return rate of 27.8%; the participation in the WS 2012/13 survey dropped to 18.6%.
Distributions of social characteristics: The distributions of the surveyed students according to the IHE, gender, subject groups, and the number of semesters, accord for the most part with those of the higher education statistics. The deviations remain small so that no further assessment needs to be made. Only the proportion of students in the New Federal States is from the outset chosen to be greater in order to perform analyses that are more sophisticated and comparisons by subjects or other features.
Representativeness of the findings - Based on the selection and consistency of important characteristics between higher education statistics and the Student Survey, the results may be assumed largely representative for the currently enrolled 2.7 million German students at 107 universities and 216 universities of applied sciences. This is equally true for the comparison of the subject groups. The comparability of the findings of the various surveys is ensured given the small variation of the universities and colleges as well as a consistent selection and number of students interviewed.